Data warehousing

and BI SOLUTIONS

10+ years experience in implementing projects for

largest Russian and international companies

Tell us about your project

Thank you!
Our managers will contact you soon

Our expertises & services

We worked with Adidas, Danone, Auchan, Rostelecom, Russian Railways, Yandex.ru, MVideo and others

Key technology stack

Oracle DB

MS SQL Server, incl SSIS, SSAS, SSRS

PostgreeSQL

MicroStrategy BI

Microsoft Power BI

Data warehouses based on MS SQL

Audit of current DWH/ DataLake solutions

DWH data model, data marts development

ETL processes development 

OLAP development

Data Lake development

Microsoft Power BI

Development of complicated metrics in DAX

Development of template reports, interactive dashboards

Consolidating data from your Data Warehouse, Excel documents

Web-site and other Sources in a single convenient online report

Implementation of custom visualizations and R-powered visualizations 

Export of Power BI reports to your Web-site or custom application

MicroStrategy BI

Audit of current BI solution

Development of solution architecture

Data storage based on the  specifics of the BI solutions

Setting the semantic layer, creation of attributes, facts, metrics

Development of template reports, desktop & mobile dashboards 

Development of models and data cubes data mart design in RDBMS

Oracle DB Services
Oracle advanced Support and Outsourcing
License Consulting to meet the cost-efficiency 
Oracle Database performance tuning and troubleshooting

Auditing and Information Security Technical Consulting in Oracle

Designing ETL flow, db model and BI datamarts (3NF, OLAP, Data Vault)

MS SQL Services

MS SQL: T-SQL development

License Consulting to meet the cost-efficiency 

Development ETL data flow on Microsoft Integrations Services (SSIS)

MS SQL OLAP development based on Microsoft Analysis Services (SSAS)

MS SQL DB performance tuning

Partnership with us and cost of services

Interviewing staff for specific project

Interviewing staff on the part of we can be arranged at the Client's request before entering into a contract. The interview can be held via means of video communication or as a part of the business trip.

Partnership directly with a Client
According to this scheme we enter into a contract directly with a Client. In this case it’s more practical for our specialists to carry out the tasks that would not necessarily require their being on-site. 
Cost estimation and agreement processes

To estimate the costs a local partner or a direct Client cooperates with us to define the parameters of the following services. The service parameters are described then in the specification to the contract agreement.


For instance, in order to define the development cost, the parameters of the given technical task are discussed and agreed. These parameters directly identify the requirements and the price of development. This stage is provided free of charge.

Partnership through a local partner

Under this scheme a local partner, a registered company that presents IT services on its Client’s territory, enters into a general contract on providing IT services with a Client directly and a subcontract agreement with us as well.


For instance, when developing the customer software, it may be practical for a local partner to perform such duties as pre-sale activities, interaction with a Client and preparation of requirements (BRD) while we deal with the development as a part of a subcontract agreement.

Pricing and working models

We offer two cost estimation models: outstaffing and outsourcing of design and development services. Under the outsourcing scheme services provided by us have either fixed SCOPE and timeline parameters, or fixed parameters according to SLA scheme. Pricing should be done beforehand.


Under the outstaffing scheme a Client or a local partner provides payment for a definite number of man-hours of specialists that carry out their profile tasks within a specific period of time under the direct supervision of a Client or a local partner.

Off-site and on-site operations

Off-site operations are preferable in a long-lasting cooperation. However, it’s possible to arrange local business trips for specialists in order to deal with the critical project stages. Off-site means of communication are provided via VPN, videoconferencing (Skype, etc) and other means of communication preferred by a Client.


To provide Oracle technical support we possess the full set of necessary technical equipment, software (server and operating system platforms), multiple communication paths and broadband. It gives us the opportunity to simulate the possible situations on-site.

Customer showcases

ETL on SSIS for SQL DWH

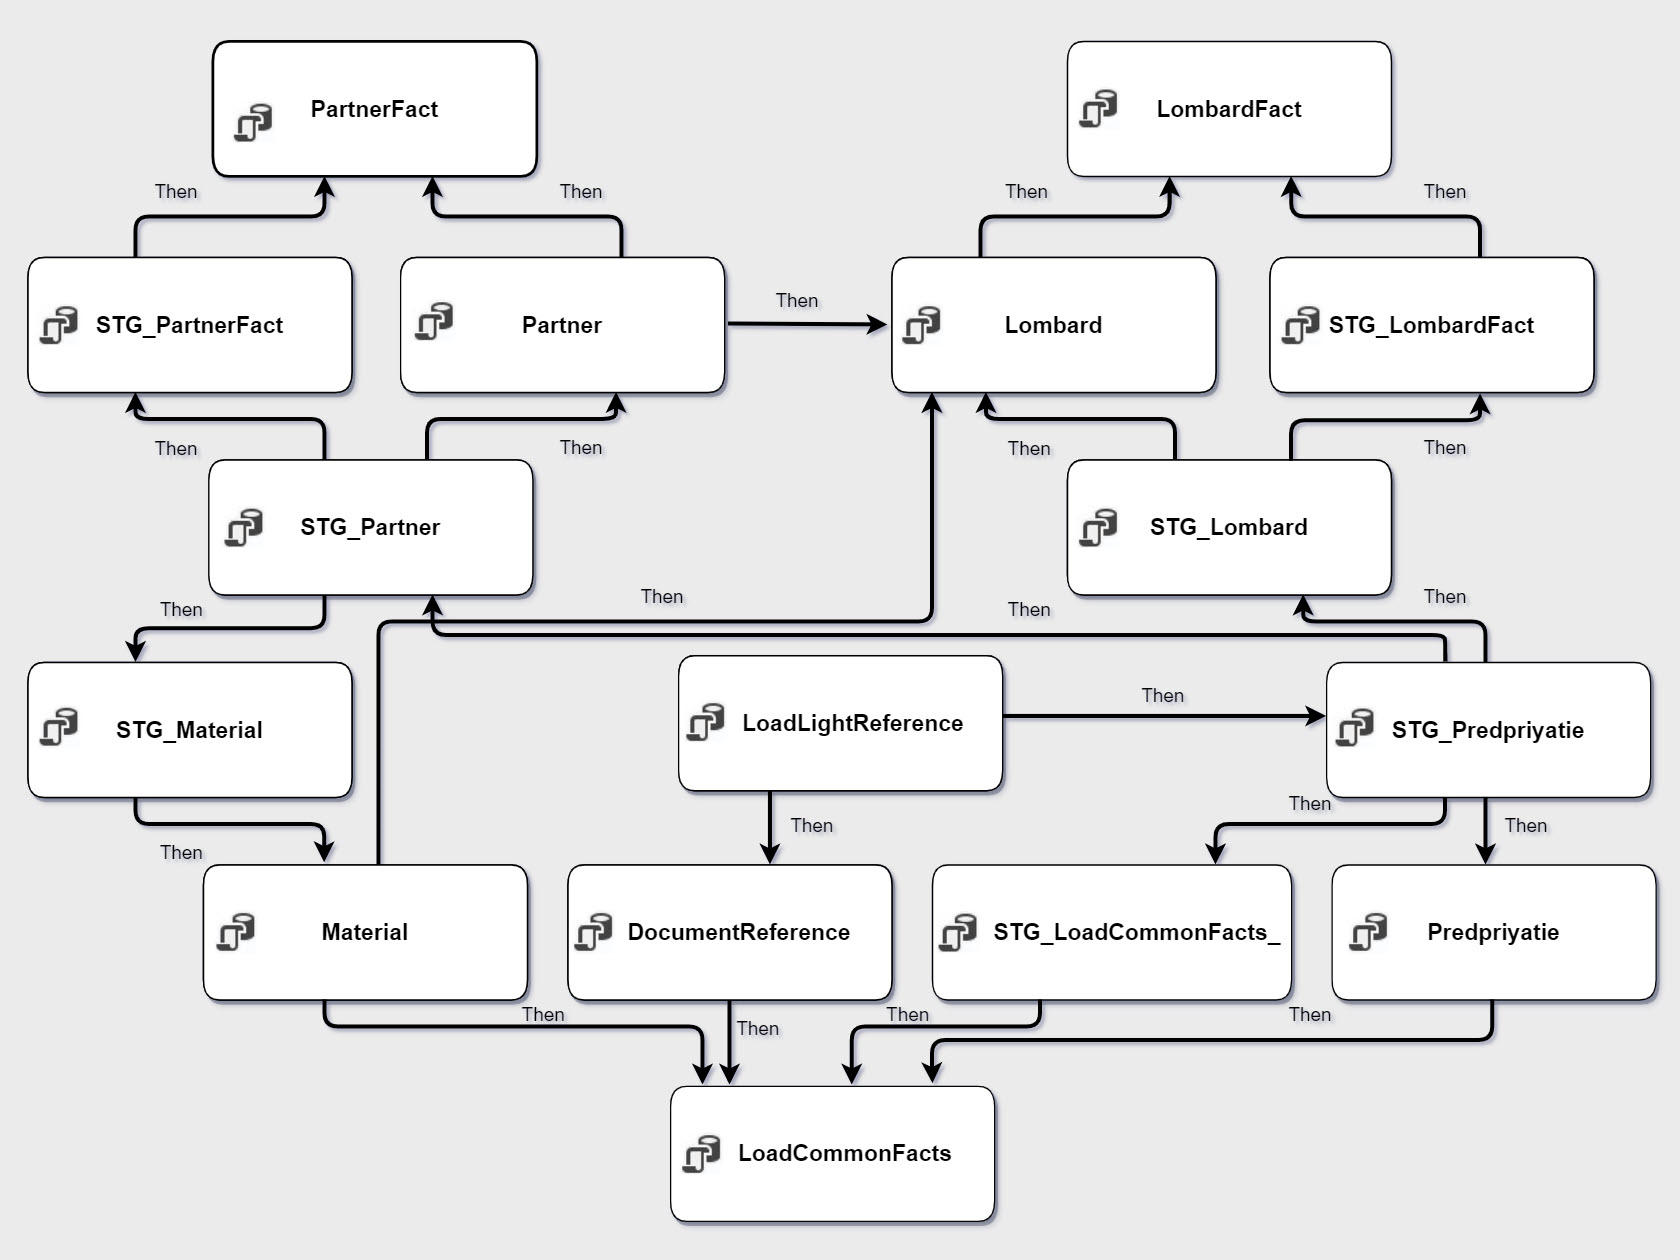
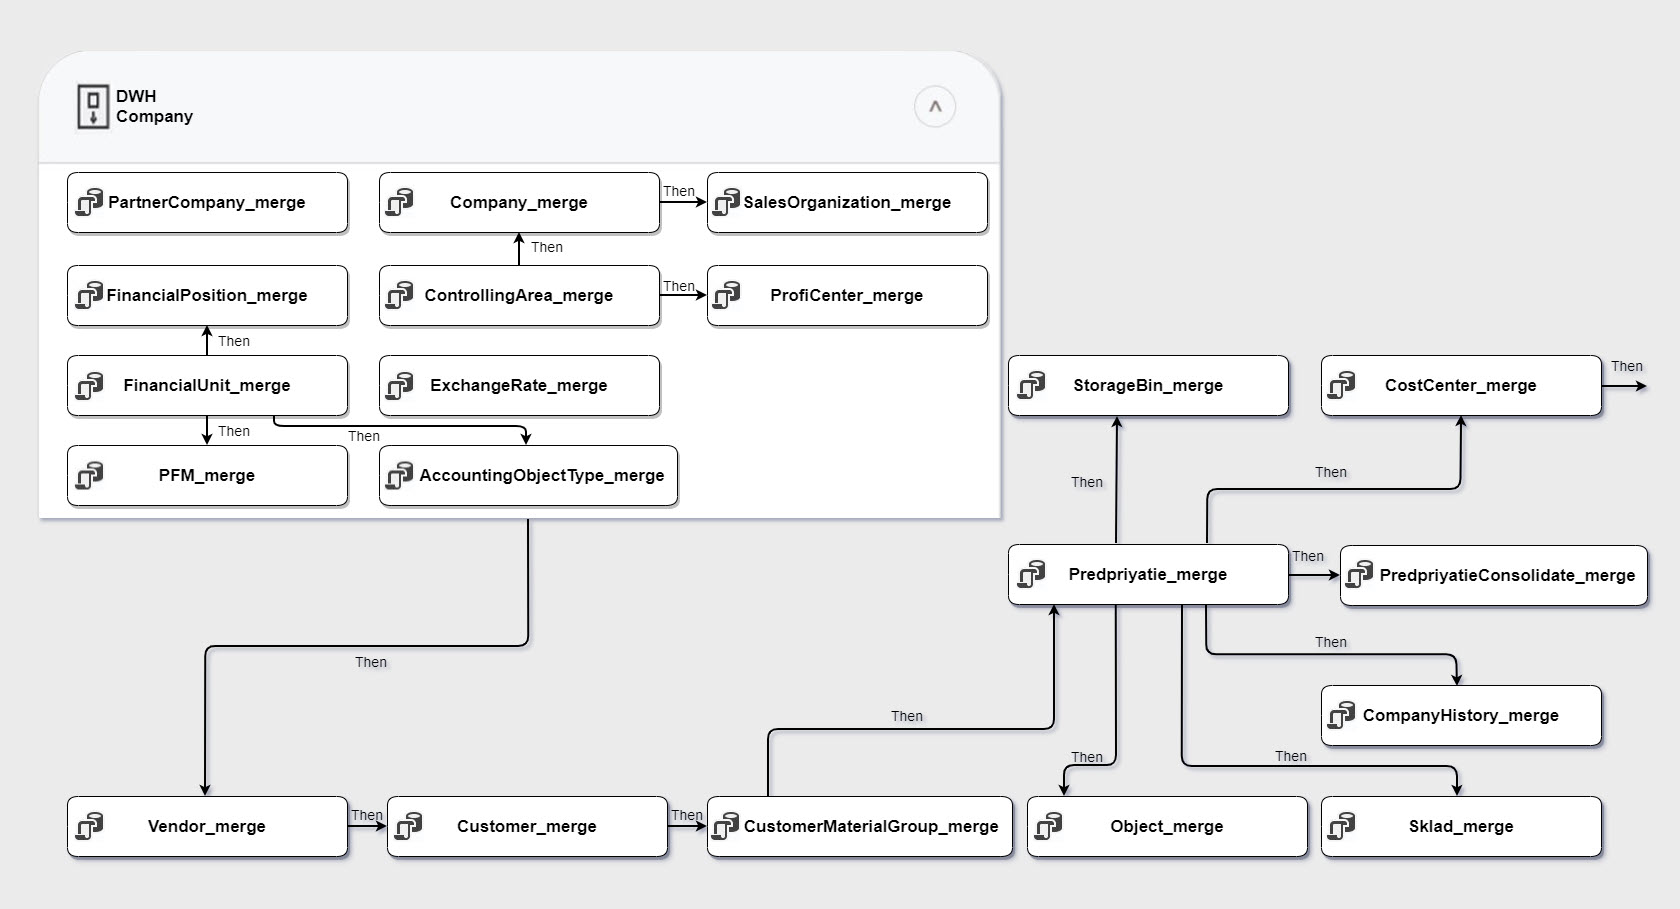
Our team has implemented a project on development of single data warehouse, and an automated IFRS reporting system based on MS SQL Server for large commercial bank. The project tasks included the data load processes automation from 10 accounting and registration bank systems, development of MIS and IFRS reporting systems through transformation from Russian accounting standards to MIS and IFRS, forming OLAP cubes and BI reporting based on SAP BO.

MicroStrategy BI reports

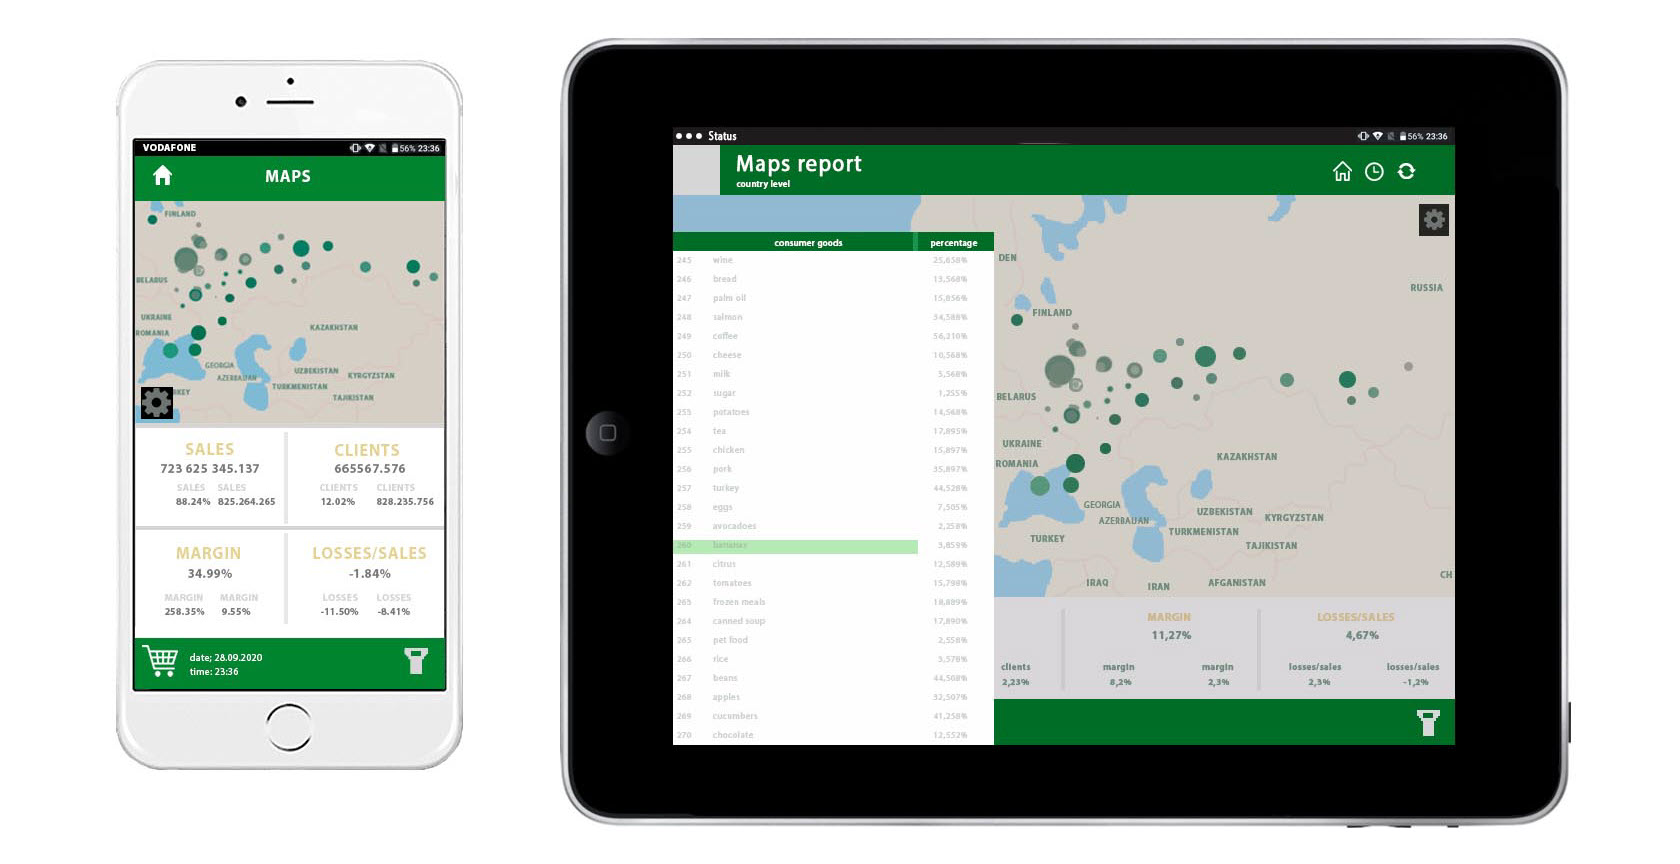
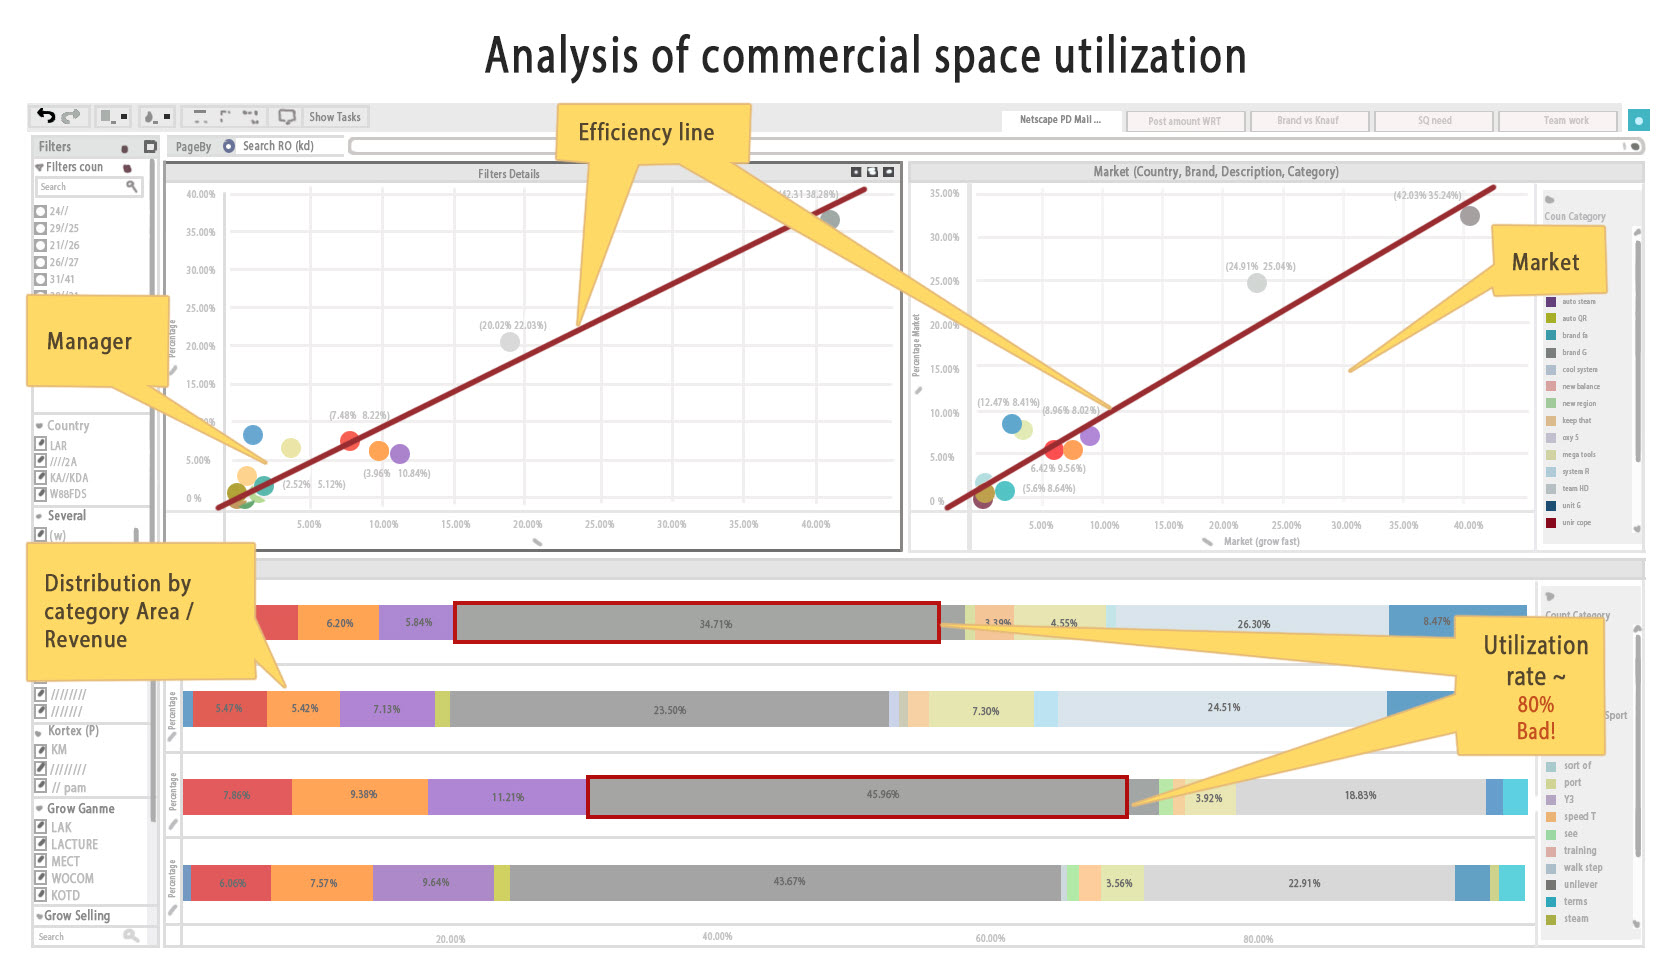
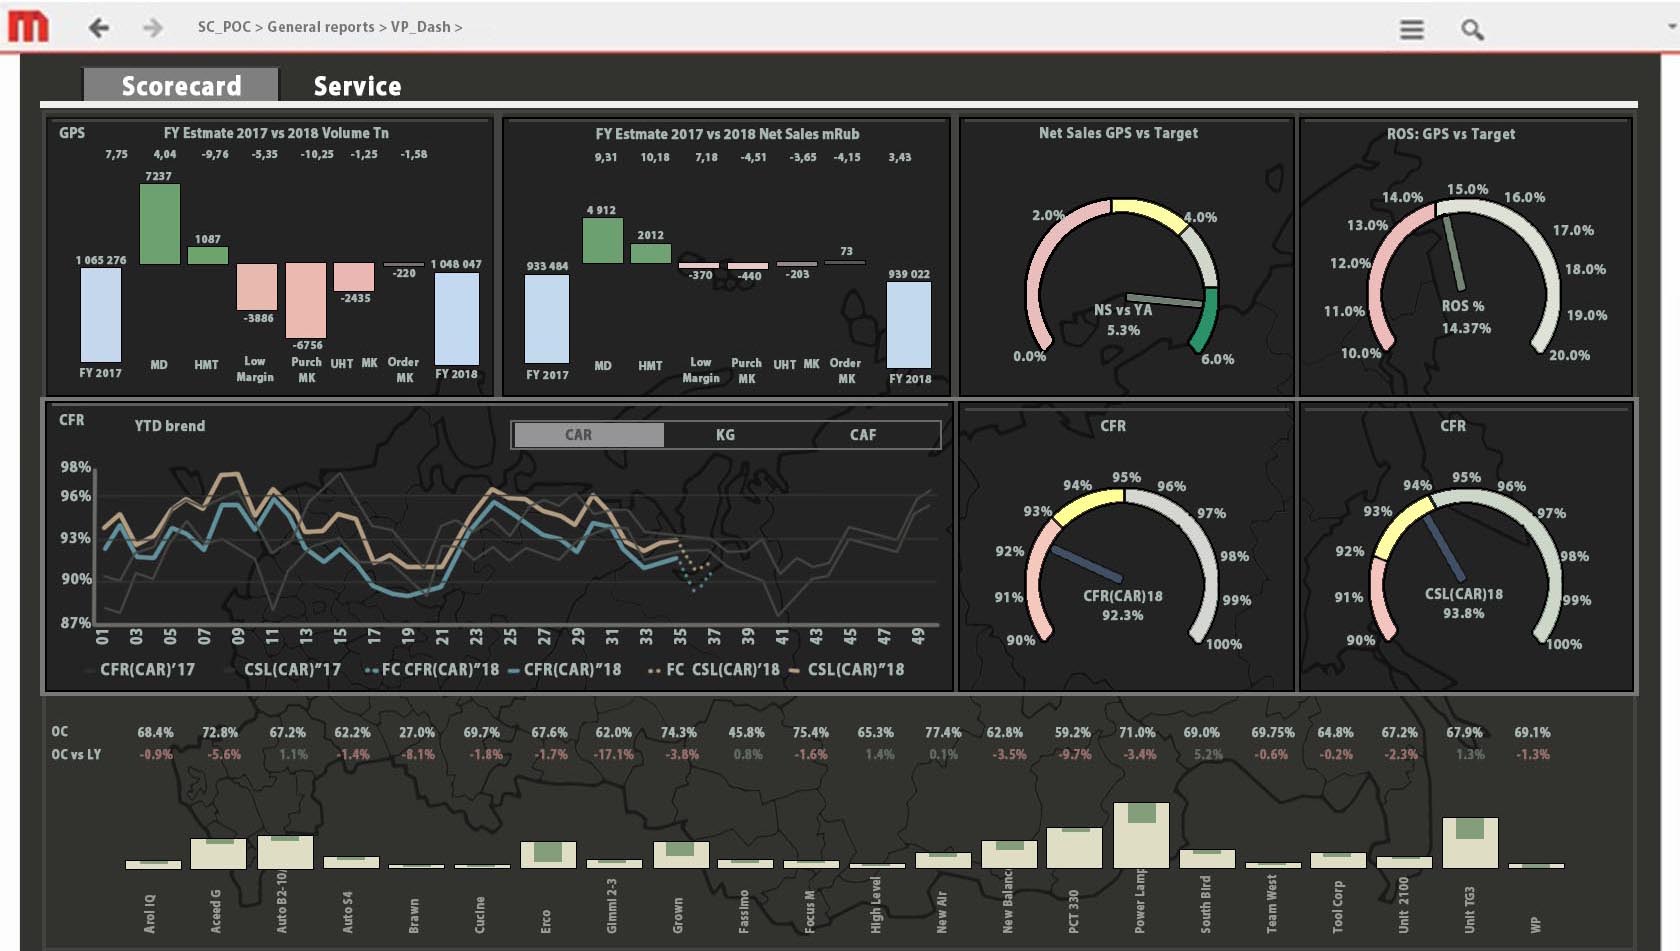
Our team, specializing in MicroStrategy BI, has implemented a large project on development of single Business Intelligence system for leading consumer goods manufacturer and supplier. Based on a single BI solution, a balanced KPI system was developed. It comprised more than 250 metrics from revenue, conversion, and income up to deficit of a certain commodity at a point of sales. KPI’s were defined on every organizational level of the company: from top management to a salesperson.

Data Visualization in Power BI

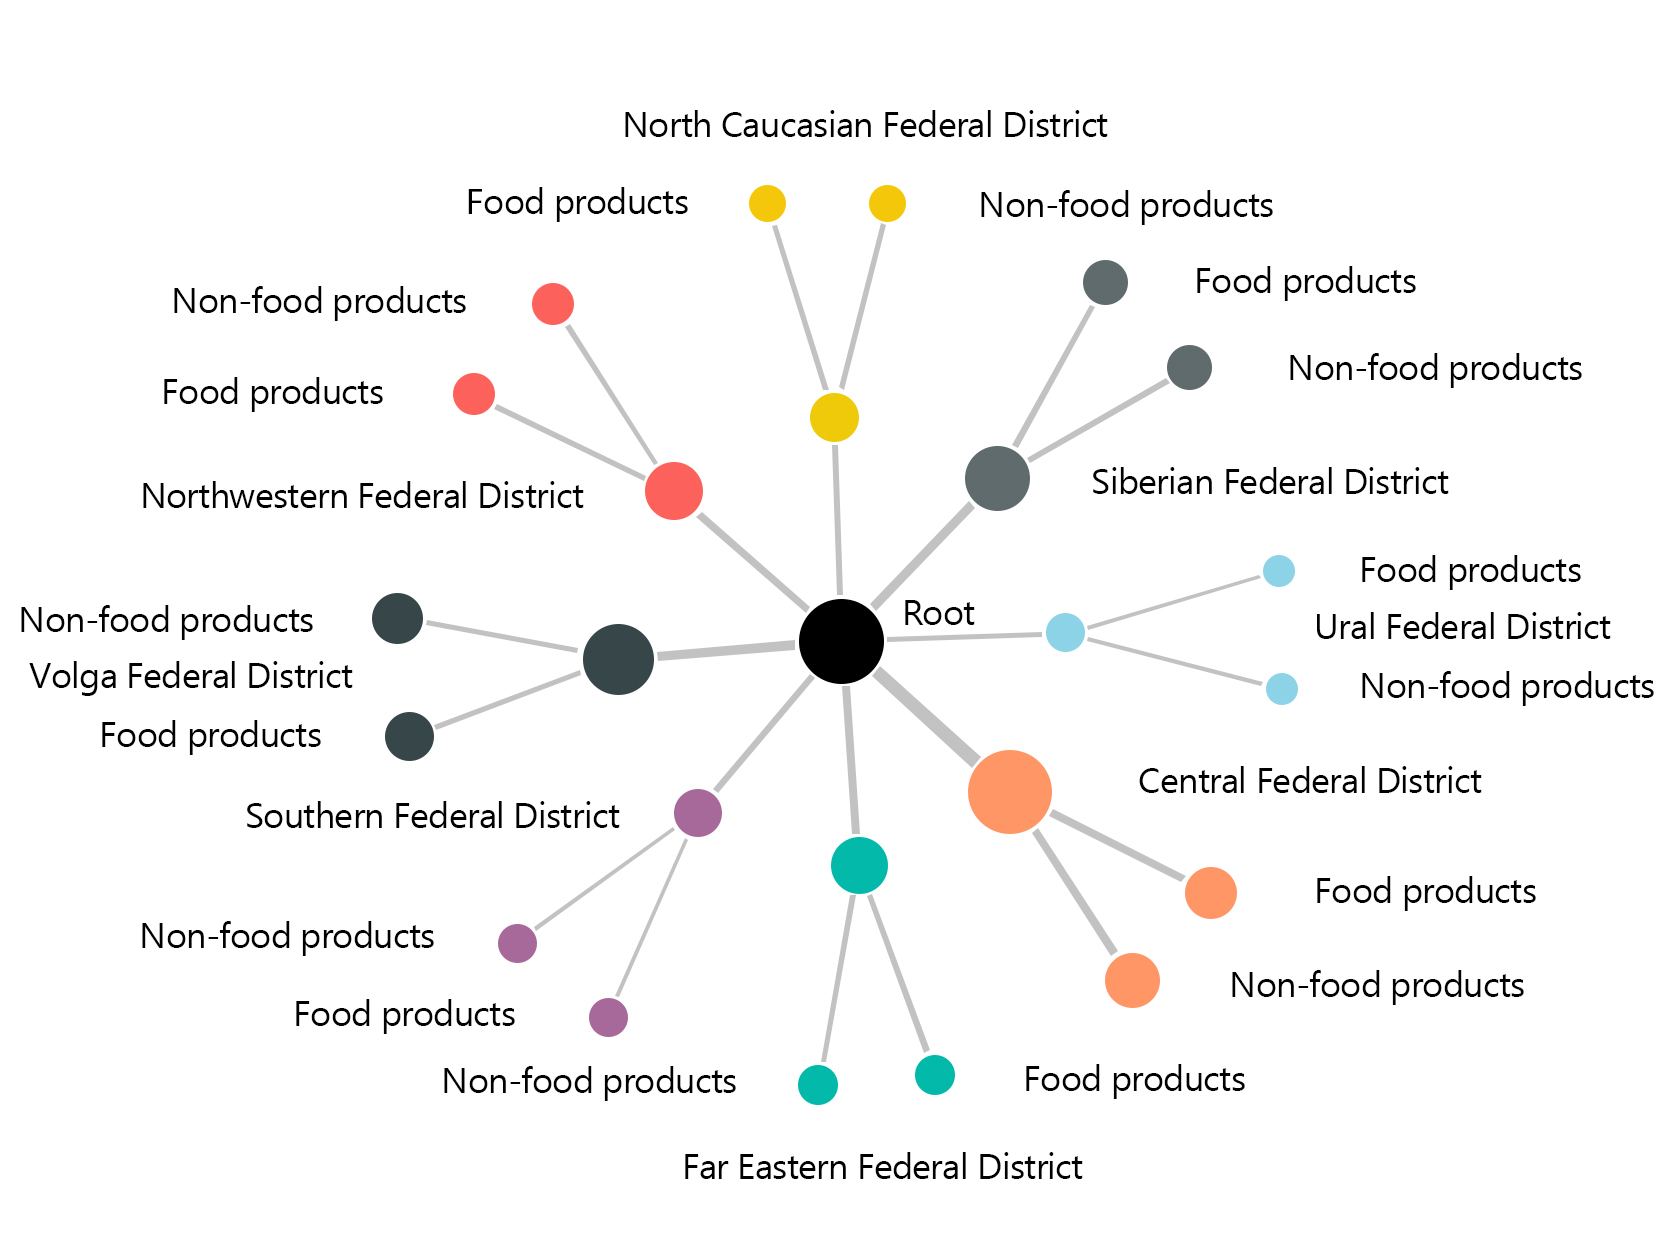
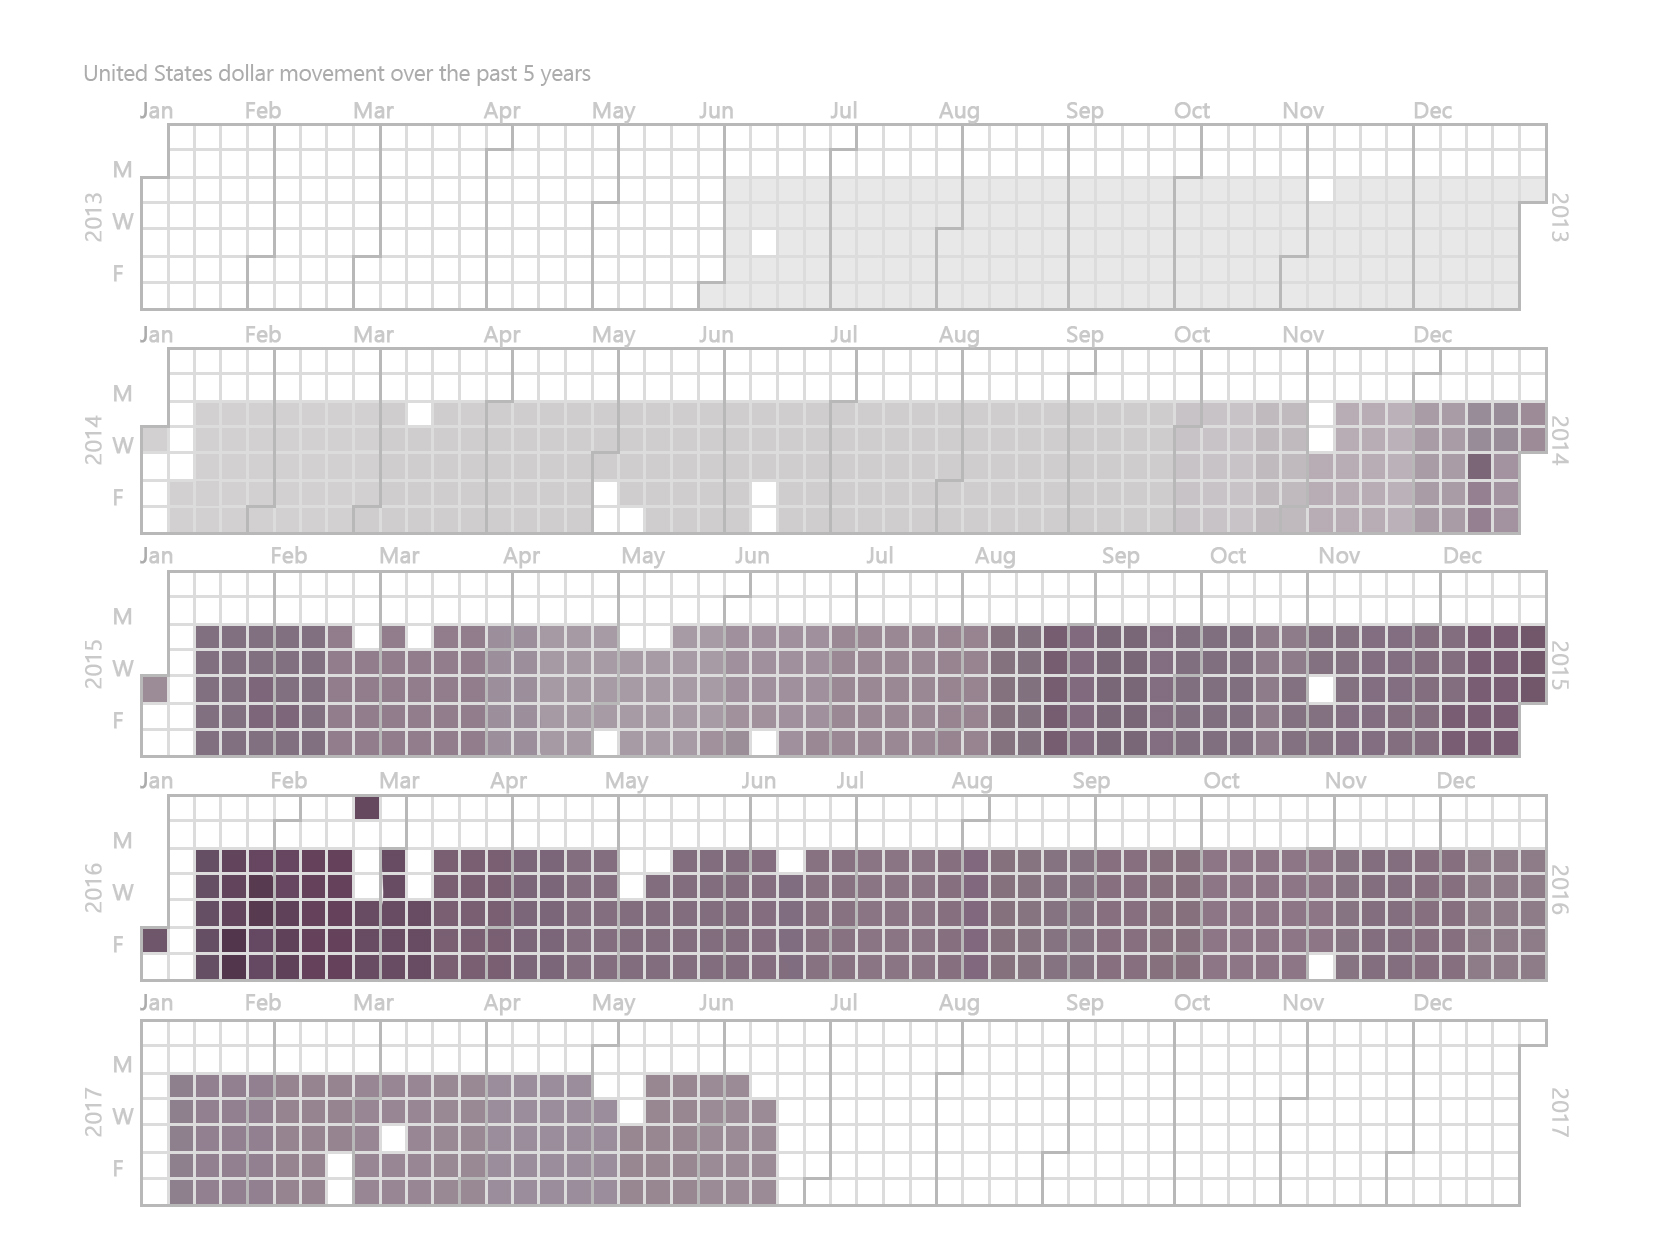
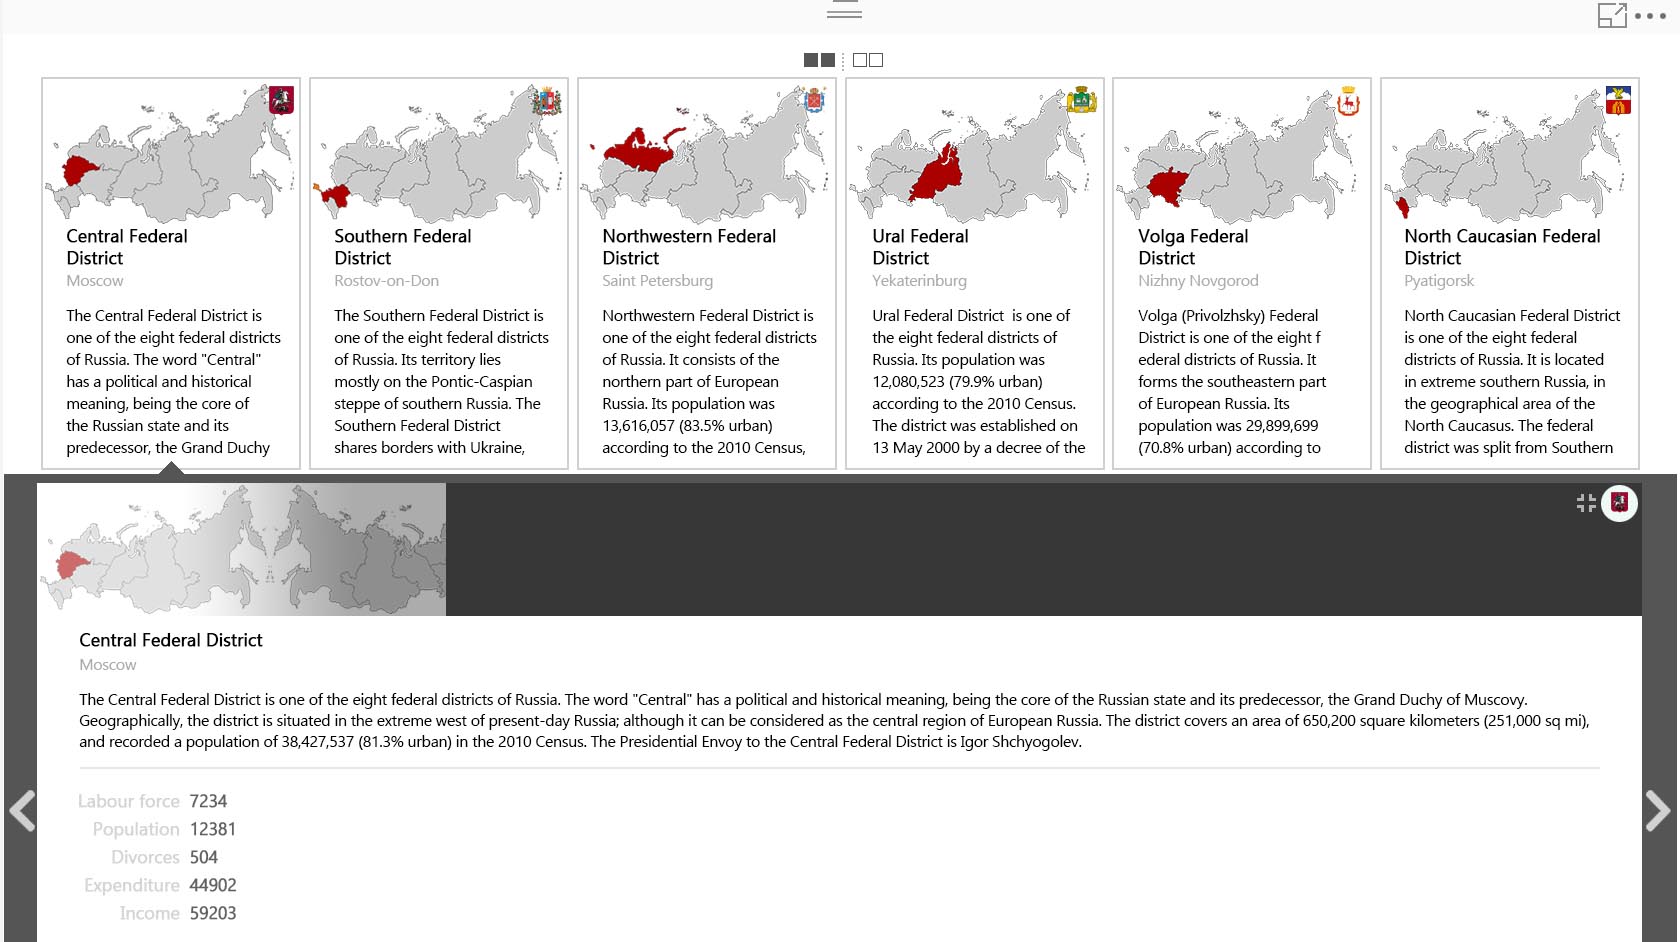
Our team has implemented a small project based on Power BI for a Scientific Research Institute in Moscow. Power BI is a Microsoft BI tool available on a free-of-charge basis that allows to quickly solve applied visualization tasks. The project implied setting interactive Power BI dashboards on Scientific Research Institute internal data and data from open sources such as the Russian Statistics Agency, World Bank, and World Trade Organization.

Read showcase

ETL on SSIS for SQL DWH

Time limit for data load and calculations in the data warehouse was set from 11 p.m. till 6 a.m. every night. Total data warehouse volume at the time of implementation was more than 15 TB.

In this case, we will only cover the ETL process aspects, i.e. the process of data loading from different sources and its transformation in the DWH.

Microsoft Integration Services tool, which is a part of Microsoft SQL Server Enterprise Edition, was used to implement the ETL process. Our specialists created a metamodel to reduce labor expenditures and increase flexibility of ETL configuration based on MSIS. The metamodel describes typical operations, that generate SQL requests with custom settings. The settings are passed from MSIS packages. ETL process workflow allows data extraction from source databases to DWH Staging layer, data transformation to DWH data model, data quality checking, and calculation of data marts.

Metamodel for the ETL process based on MSIS facilitated the tripled reduction of labor input and development time. This effect became possible due to the templates creation for the following common ETL tasks:

1. Full dimension tables reading.

2. Incremental fact tables reading by sliding window.

3. Incremental fact tables reading by row change date in the source system.

4. Detection of deleted rows in the source system by comparing the new load scope to previous loads result.

5. Saving the history of changes in dimension tables (if needed).

Furthermore, within the ETL metamodel following service functions were implemented for every ETL step:

1. Saving ETL steps log.

2. ETL steps progress monitoring from smartphones.

3. Automatic ETL process part restart, which encountered a problem without analyzing all the dependencies in the SSIS packages.

4. Et al.

The final step of the daily ETL routine is the generation of data quality reports for all business areas.

Implementation of the ETL project part allowed us to achieve the following results:

1. An architecturally correct data collection and data load from a dozen source systems to a single Data Warehouse in the volume necessary for MIS and IFRS reporting in a short time.

2. Data quality control for all business areas was implemented that allowed service desk employees to promptly identify problems with data (no matter on which step the error occurs) and solve them before the error reaches final users’ reports.

3. Using the ETL metamodel helped to reduce the ETL development labor intensity and to standardize its steps, that reduced support and bug-fixing labor costs by 30%.

ETL development took 7 months. The whole project was implemented for 2 years.

Read showcase

MicroStrategy BI reports

Project goals included an initial audit of the current BI solution IT environment. The audit revealed multiple inconsistent data flows between all kinds of IT systems based on various platforms that formed reports on similar business indicators in different BI systems. It turned out that all client’s reports showed different “versions” of the truth. Further described infrastructure development, not to mention the single KPI map creation on its basis, was not possible.

Pic. 1. Example of mobile BI report on MicroStrategy basis

As the audit result, our team offered a step-by-step plan towards a single data warehouse based on MS SQL Server and a single BI platform based on MicroStrategy, which made it possible to:

  • eliminate duplicate data flows and increase data quality due to intermediate control;
  • define the single truth for every KPI in a single BI solution;
  • establish a common business vocabulary of data and determine data transformation process on every stage;
  • reduce cost on the current IT environment maintenance;
  • get transparent Management of access rights differentiation; etc.

Key reasons for choice towards MS SQL Server and MicroStrategy platforms:

  • client’s requirement of integration with proprietary solution with supplier’s support hotline;
  • choice of leading platforms based on multi-criterion function analysis with optimal license/support cost.

Pic 2. Dashboard for analysis of the effectiveness of the use of commercial space

One of the tasks to be solved, besides the challenges of gathering data in the DWH and setting the calculations of KPI’s, was to prove the correctness of the new KPI system calculations based on MicroStrategy BI compared to the calculations in previously existing systems. To solve this problem, we worked out a step-by-step data validation methodology for each field. The methodology helped to detect multiple errors in previous BI reports. We set data quality and data governance processes to eliminate possible errors in the future.

Pic. 3 One of the dashboards on key performance indicators

Based on a single data warehouse and a single MicroStrategy BI solution desktop, as well as mobile reports, a higher-level KPI for company's top and middle management has been developed. Analysts got the possibility to create flexible ad-hoc reports based on MicroStrategy in-memory OLAP data cubes. It made it possible to transfer the reports creation function from the BI department to profile analytics departments.

As a result of the project following goals were achieved:

1. The problem of difference in the values of the same indicators in various report types for different departments in multiple BI tools was solved.

2. A single system of BI indicators for all organization levels from salesperson to a top manager was introduced. The company’s motivation system is now based on KPIs computed in the single Data Warehouse based on MS SQL Server and MicroStrategy BI.

3. The new solution scalability was facilitated due to introduced transparency of KPI calculation processes, namely Data Governance including documentation of all key algorithms and data flows.

The project was implemented for 2 years.

Read showcase

Data Visualization in Power BI

In this project we didn’t have to solve typical data quality problems and there was no need in building a data warehouse or data marts. The datasets were prepared by the client and provided as PostgreSQL DB structures.

Pic. 1 Consumer products graph

Based on these structure dashboards and visualizations, revealing main data insights, were set within 4 days.

Pic. 2 Exchange rate calendar

The project was implemented for 4 days.

Pic. 3 Per district detail view

Berlin, Germany

Corneliusstraße 3
+49 (305) 201-51-66
Hialeah, United States
580 W 46th St dept 245
+1 (786) 796-14-33